It is probably fair to claim that the three things most people care most about, in no particular order, are their health, their loved ones, and their financial security. Given the importance of financial security in the hierarchy of human concerns, it cannot be surprising that investors are generally quite averse to the risk of financial loss, particularly losses that are large and potentially permanent. So it follows that investors are sensitive to developments that might signal increased risk of financial losses. What is less rational, although quite common, is the propensity to focus excessively on negative events (that have already occurred or might occur in the future) while minimizing consideration of potential positive outcomes. Since market prices reflect existing information and aggregate expectations, an outcome (such as weak company earnings or overall economic growth) that was less negative than market expectations is actually something to which markets are likely to respond favorably, and is therefore a positive event. In other words, if bad news is less bad than expected, that is good news for markets.
These are not just theoretical musings; an understanding of the interplay between market expectations and human psychology is essential to the ability to assess market risks, and to construct and maintain an appropriate investment strategy.
The aversion to financial loss often results in many investors having an outsized and therefore irrational expectation that future outcomes will be negative. This type of irrational pessimistic expectation occurs most often when recent events have been negative, leading investors to extrapolate such expectations forward. It also often occurs when there is a strong unfavorable consensus about the future – people tend to be influenced by what others are saying and tend to adopt the consensus view, which they hear and read on a daily basis. This groupthink tendency also occurs when the majority of investors are excessively bullish, leading to the crowd generally being wrong when there is a very strong positive consensus about future market direction. The result is that investors are typically very bearish in aggregate at market bottoms, and very bullish at market tops. This groupthink and extrapolation of the recent past leads to buying high and selling low, the opposite of what investors should do. There is a high cost to going with the crowd, as opposed to independent thinking which views market corrections as opportunities and extended market rallies as potentially leading to dangerous bubbles.
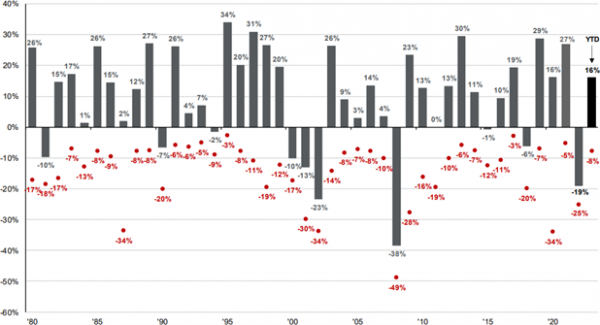
While the tendencies to be increasingly bearish after a correction and bullish after a rally are both irrational, they are not equally so. This is because markets tend to produce positive returns in most years: over time, the US stock market has provided positive returns in roughly 75% ofyears. So, while investors who are excessively fearful and focused on negative events may have some rational basis for their fears (concern for loss), they are generally wrong and, if they act on their fears, they miss out on opportunities for growing their wealth.
Graph 1 shows the S&P 500 calendar year returns (in gray) going back to 1980, as well as the biggest intra-year decline (in red). Despite large intra-year corrections, stocks were up in most years and averaged close to a 9% annual return over this period. Thus, excessive negativity is punished far more often than it’s rewarded, and investors who sold into corrections likely missed out on the gains that occurred in most years.
While there are always plausible reasons to be bearish on stocks, the reality is that investing means accepting risk and downside volatility – that is the price of being in the market to enjoy gains and portfolio growth.
Graph 1
Source: JPM, FactSet, S&P
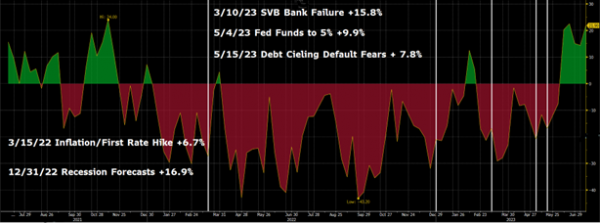
While there are always market risks looming (and the biggest ones are often not apparent or widely discussed), anecdotally it seems that in recent quarters there have been more “sky is falling” hysteria events that have dominated market sentiment than usual. Graph 2 shows retail investor sentiment according to the AAII poll of individual investors. Green shows the net percentage of respondents that were bullish on the stock market (percent bullish – percent bearish), and red shows the net bearish percentage. More green means more investors were bullish, and more red means more were bearish.
The vertical white lines correspond to dates when various negative market events occurred, or the case of recession forecasts and debt ceiling fears, the dates represent proxies for when the relevant concerns peaked.
As the graph demonstrates, each event occurred when there was a material excess of bearish sentiment. The text notes each of the five events that spooked investors, and states the return of the S&P 500 since that date. As you can see, each of these dates/events was coincident with strongly negative market sentiment, yet following each date the US stock market has produced strong positive returns. Since the beginning of the year, when most Wall Street forecasts called for a recession in 2023, the stock market has delivered a robust 16.9% first half return.
Graph 2
Source: BBG
The lesson here is one we often reinforce. Ignore the crowd and financial media pundits, particularly when most of them are expressing the same view, and above all when they are mostly bearish. Construct an investment risk profile suitable for your situation and risk tolerance, and stick with it. Make minor portfolio adjustments as assets become very cheap or expensive, and only make major portfolio adjustments as your personal circumstances change, not based on guesses about future market direction. Generally the worst market fears do not come to fruition, and as 2023 has so far demonstrated, generally the sky does not validate forecasts that it is about to fall.
Thank you for your trust, and please contact a SFA team member with any questions, or to review the alignment of your portfolio with your personal circumstances.
The information contained within this letter is strictly for information purposes and should in no way be construed as investment advice or recommendations. Investment recommendations are made only to clients of Santa Fe Advisors, LLC on an individual basis. The views expressed in this document are those of Santa Fe Advisors as of the date of this letter. Our views are subject to change at any time based upon market or other conditions and Santa Fe Advisors has no responsibility to update such views. This material is being furnished on a confidential basis, is not intended for public use or distribution, and is not to be reproduced or distributed to others without the prior consent of Santa Fe Advisors.


 To Top